

Lopez-Giraldez F., and J.P. Townsend, 2011. PhyDesign: an online application for profiling phylogenetic informativeness. BMC Evol. Biol., 11: 152.
and the program used to calculate the rates:Pond, S.L.K., Frost, S.D.W., and S.V. Muse, 2005. HyPhy: hypothesis testing using phylogenies. Bioinformatics, 21(5): 676–9.
Olsen, G. J., unpublished. DNArates. DNArates.
Mayrose, I., Graur, D., Ben-Tal, N., and T. Pupko, 2004 Comparison of Site-Specific Rate-Inference Methods for Protein Sequences: Empirical Bayesian Methods Are Superior. Mol. Biol. Evol., 21: 1781-91.
Townsend J.P., Su Z., and Y. I. Tekle, 2012. Phylogenetic signal and noise: predicting the power of a data set to resolve phylogeny. Syst. Biol., 61: 835-49.
We will soon incorporate the methods for phylogenetic signal and noise analysis based on the GTR model for a four-Taxon tree with uneven subtending branches. Meanwhile, this analysis can be performed using this Wolfram Mathematica notebook following these instructions.1) |
Uploading information for analysis |
||||
|
In order to provide an analysis of phylogenetic informativeness, PhyDesign requires the site rate
distribution for each locus. To obtain the rates, the user will need to
input two files: (1) an alignment in Nexus or Phylip
format of loci of interest pruned to contain a set of taxa for which the
tree topology is fairly well known, and (2) an
ultrametric tree for those taxa in Newick
(recommended) or Nexus format.
The ultrametric tree can be either a chronogram -- an ultrametric tree with branch lengths proportional
to time -- or it can be in unspecified molecular evolutionary units.
After uploading the alignment and the tree files, the user can choose a program from the drop-down menu
with which to obtain the substitution rates.
Once, a program has been chosen, it is possible to access to advance options where the user will be offered
with different evolutionary models and parameters.
For DNA sequences, we recommend use of HyPhy, for which a HyPhy batch file was created to implement all time-reversible
models. Unlike DNArates, HyPhy also accepts
multifurcating trees. For amino acid sequences, rate4site is provided.
To facilitate extensive analyses of large datasets, the user is also asked to provide an email address where
a link to the rates result will be sent.
|

|

|
|||
2) |
Downloading and choosing rates for profiling |
||
|
By clicking the emailed link, the user will be taken to a page similar to one in the image.
The table presents the rate estimation results for each alignment site divided by the partitions/genes
(rows) that you defined in the input alignment.
There is a link for each partition to the original output produced by the rate estimation program.
Please check this file, just in case PhyDesign is missing some error message produced by the rate estimation
program.
This table also summarizes the number of sites for which a mutation rate could be calculated (#Rates),
and the number of faulty sites for which this calculation was not possible (#Undef.).
The last two columns of the table are used to specify the partitions to be profiled and the colors for
representing them.
Profiles and color for each one can be modified here or later.
|

|
||
3) |
Manipulating profile: graph and quantitation |
||
|
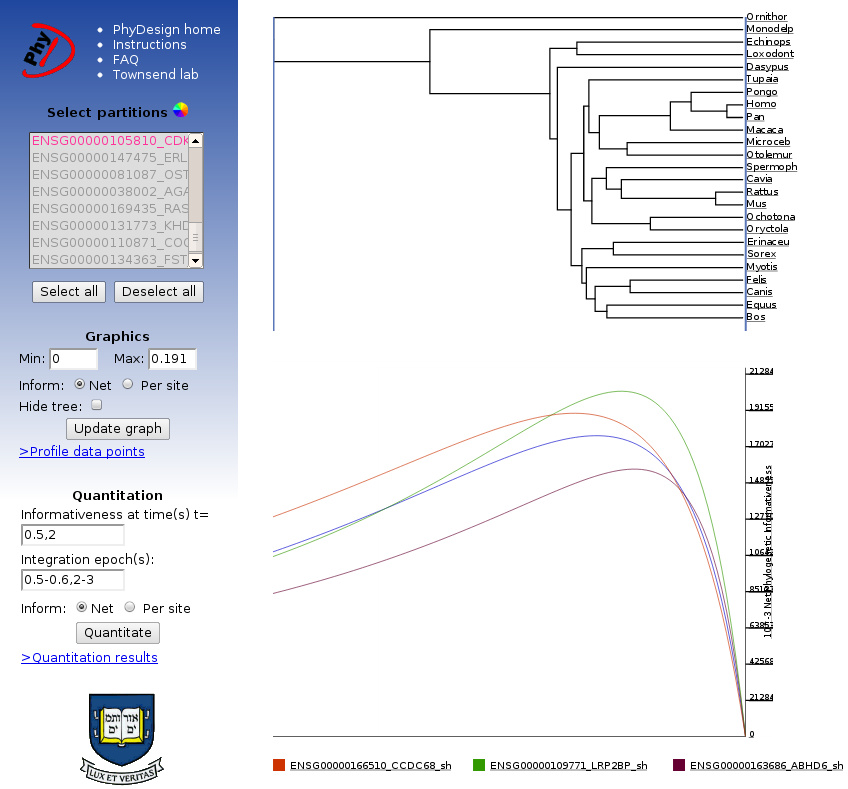
This is the interface through which the user can select partitions and colors for profiles,
adjust the range of time values (x-axis), obtain net and per site informativeness
(more info here),
integrate over different epochs, and download the results. The sidebar contains all controls
for manipulation of the data and graphics; the results are displayed on the main part of the page.
|
|
||
|
This is a sample chronogram used in the analysis process as displayed on the profiling page. The tree and phylogenetic informativeness profiles can be downloaded as displayed in SVG format by "right-clicking" on the graph. The SVG files can be further modified in any vector graphics program (such as Adobe Illustrator or the Open Source editor Inkscape). |

|
||
|
The quantitation tool at the bottom of the sidebar allows the user to integrate over - or, what is the same calculate the area below the profiles - specified epochs and obtain informativeness values. The quantitation results file which can be downloaded is updated with the new calculations every time the quantitation form is submitted. The quantitation data table includes the number of rates, mean rate, standard deviation from the mean of the rates, and integration values based on the quantitation tool. Integrating phylogenetic informativeness over specific epochs provides a metric for ranking loci. Integration values will be largest for the loci that have the highest probability of substitution in the given epoch that will not be obscured by subsequent evolution. Note, however, that phylogenetic informativeness plots quantitate and display predicted signal and do not account for phylogenetic noise. Thus, quantitative results should be thoughtfully considered in light of homoplasy that is likely to arise and diminish utility during epochs deeper than the peak of informativeness for a given profile. We have tested PhyDesign with 2000 loci with a length of 1000bp each. Although plotting 2000 profiles is possible, numerical informativeness values might be more practical for these problem sizes. If the user wants to analyze a higher volume of data, one can download |


|
||